cloud-ops-sandbox
Learn about Cloud Operations services and tools that Sandbox uses
Cloud Operations suite of services provides products for both developers and DevOps engineers and can work across multiple cloud platforms. It provides means for engineers to implement Application Performance Management (or APM) by observing and detecting reliability problems as well as by investigating them at runtime. The Cloud Operations suite provides the following products for APM:
You can find the Cloud Operations products in the navigation panel on the GCP Console:
Cloud Trace
Cloud Trace (see documentation) enables developers to see distributed traces that visually expose latency bottleneck in distributed transactions of the application. Developers have to instrument tracing capabilities into application code. Trace metadata can including additional information about environment and can also correlate with application logs ingested to Cloud Logging. Cloud Trace GUI can show relevant log events within the trace timelines.
Online Boutique uses OpenTelemetry SDK to instrument its microservices (written in 5 languages) to capture tracing information.
Using Traces
To bring up Cloud Trace, type Trace in the Search area of the Google Cloud
Console or select Trace in the Console’s navigation panel.
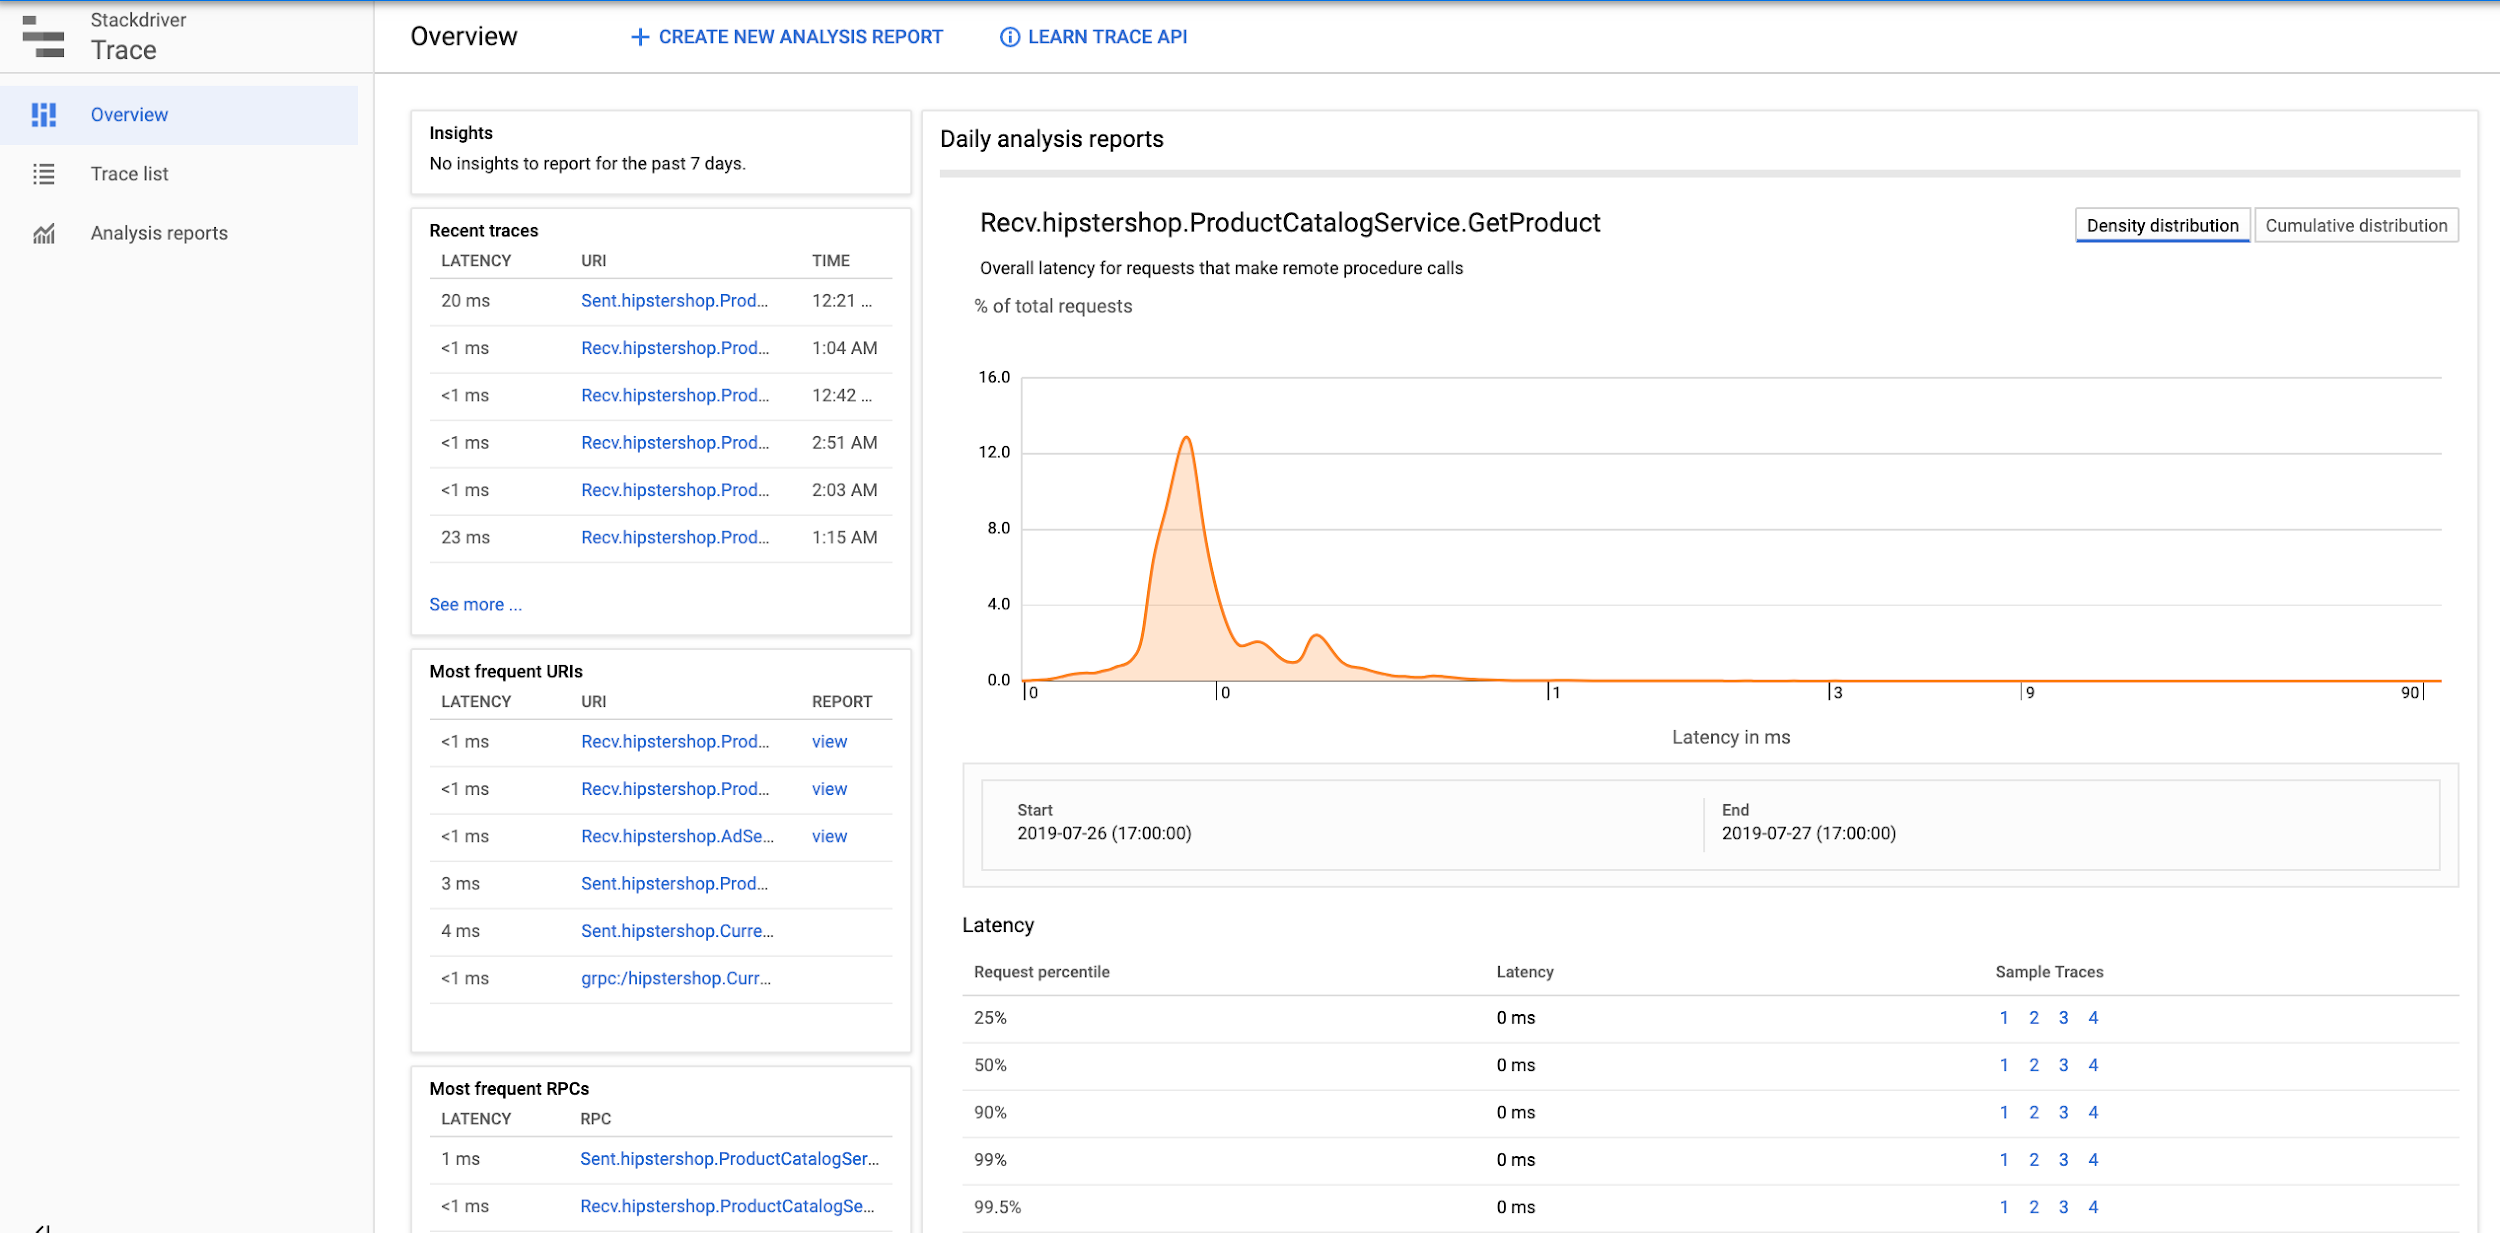
This takes you to the Trace Overview page, where you can see all traces
generated by Online Boutique microservices:
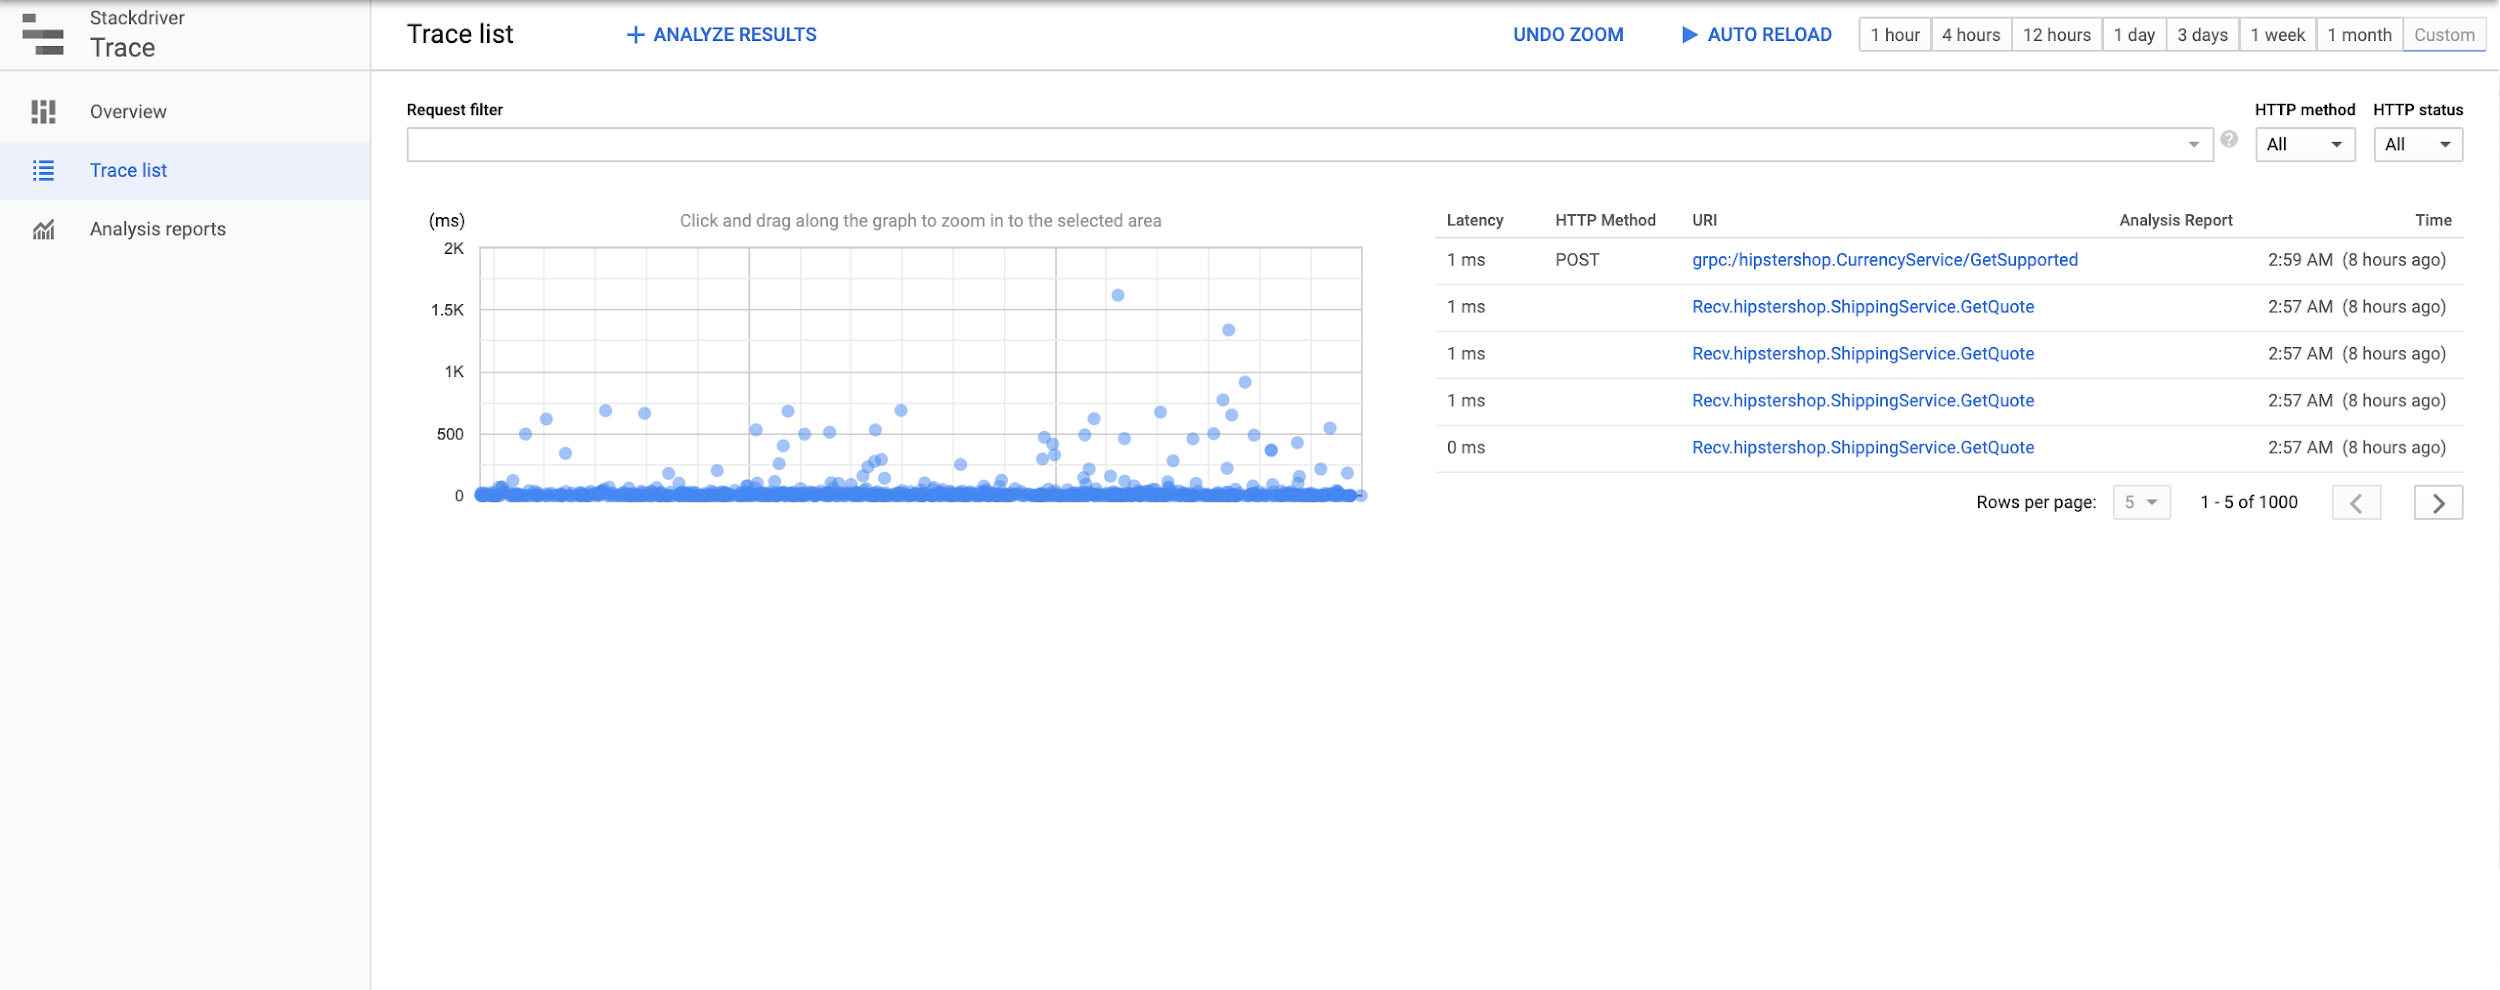
Select Trace List in the navigation panel to explore all traces for a particular
time period:
Selecting any trace on the diagram shows a detailed view and breakdown of the traced transaction into subsequent calls.
Finally, select Analysis Reports in the navigation menu to see a list of reports
that were generated or to create a new report for a particular type of traces.
Note that if you have just launched Sandbox, you may not see many traces or any reports.
Cloud Monitoring
Cloud Monitoring (documentation) is the go-to place to grasp real-time trends of the system based on various metrics. Cloud Monitoring collects platform metrics as well as application metrics. You will be able to explore metrics reported by control and data planes of GKE, Anthos Service Mesh (ASM) and application metrics generated by Online Boutique. SREs and SWEs team can collaborate to set up charts on the monitoring dashboard using metrics sent from the resources and the applications.
Using Monitoring
Same as with Trace you can get to Cloud Monitoring in Google Cloud Console by searching
for Monitoring or selecting Monitoring in the navigation panel.
You will get to the Overview page:
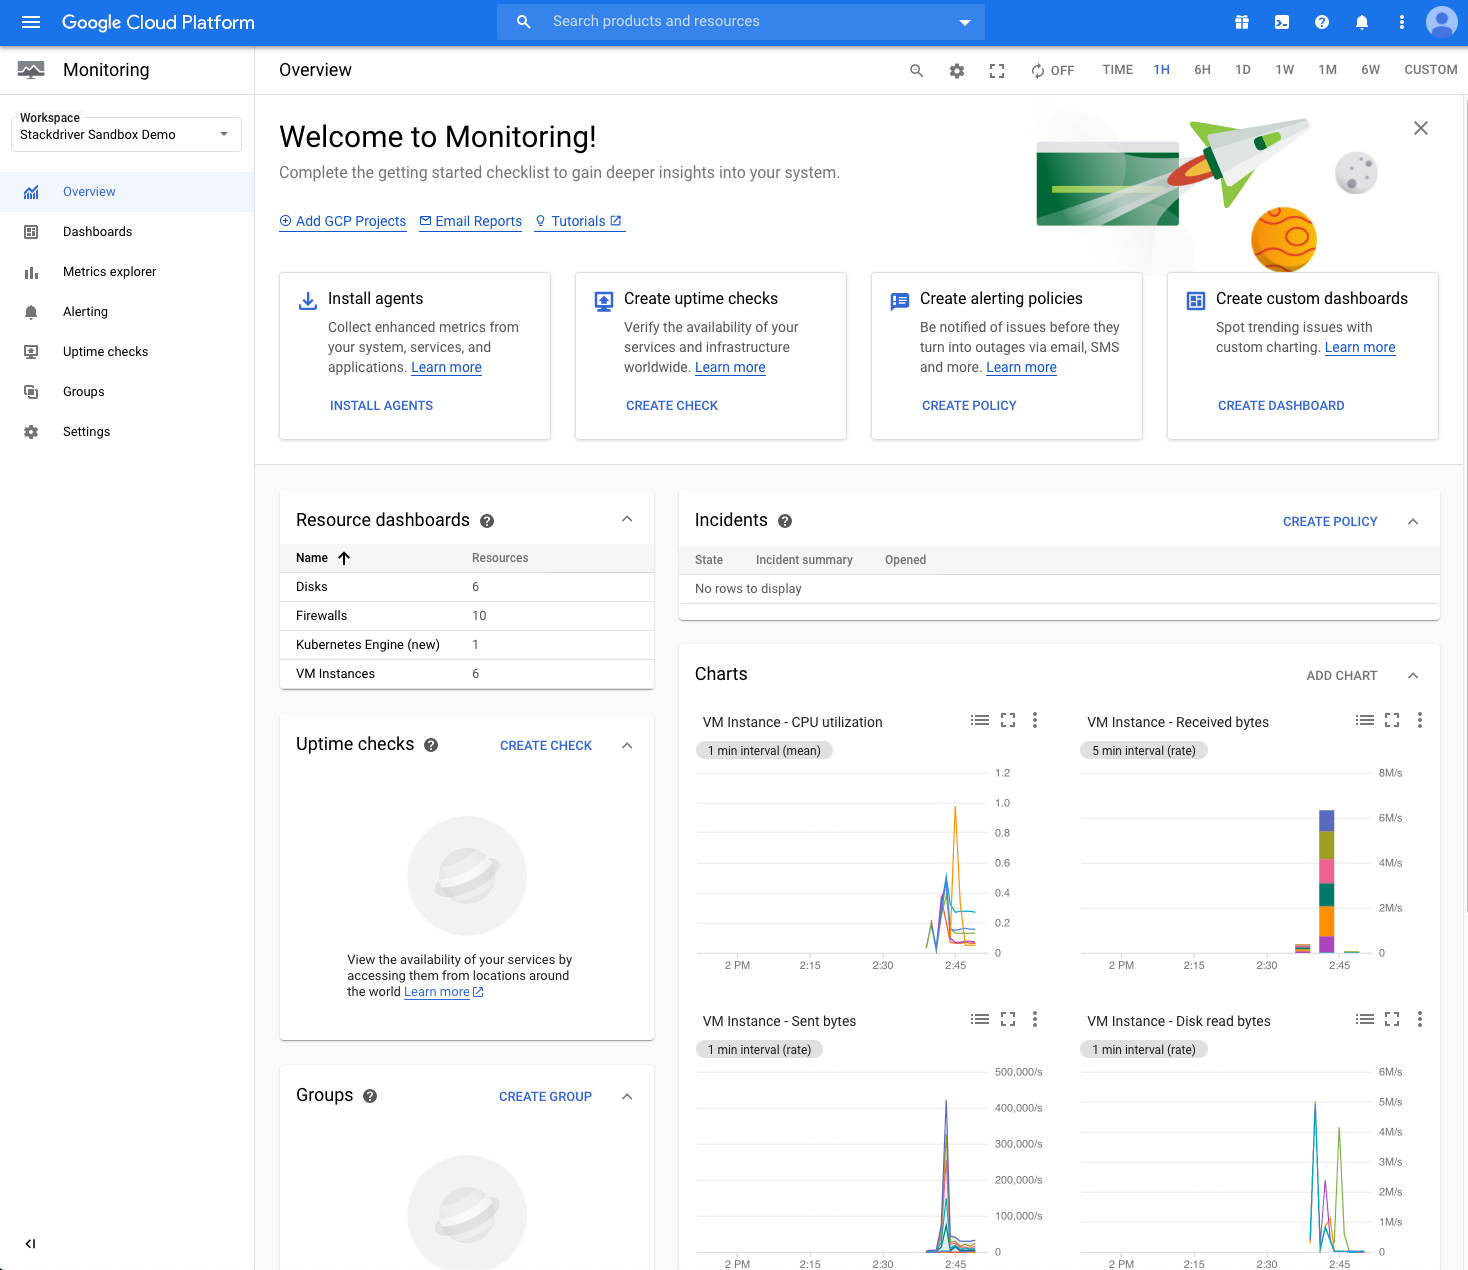
It shows many pre-built charts and widgets like GKE cluster details.
You can explore metrics by selecting Metric Explorer in the navigation panel and
filtering metrics by metric type and additional parameters that depend on the kind
of the metric. The following screenshot shows the custom metric of the type
custom.googleapis.com/opencensus/ grpc.io/client/completed_rpcs (displayed as “OpenCensus
//grpc.io/client/ completed_rpcs”) and filtered on grpc_client_status label to
keep only those time series where the label’s value is not “OK”.
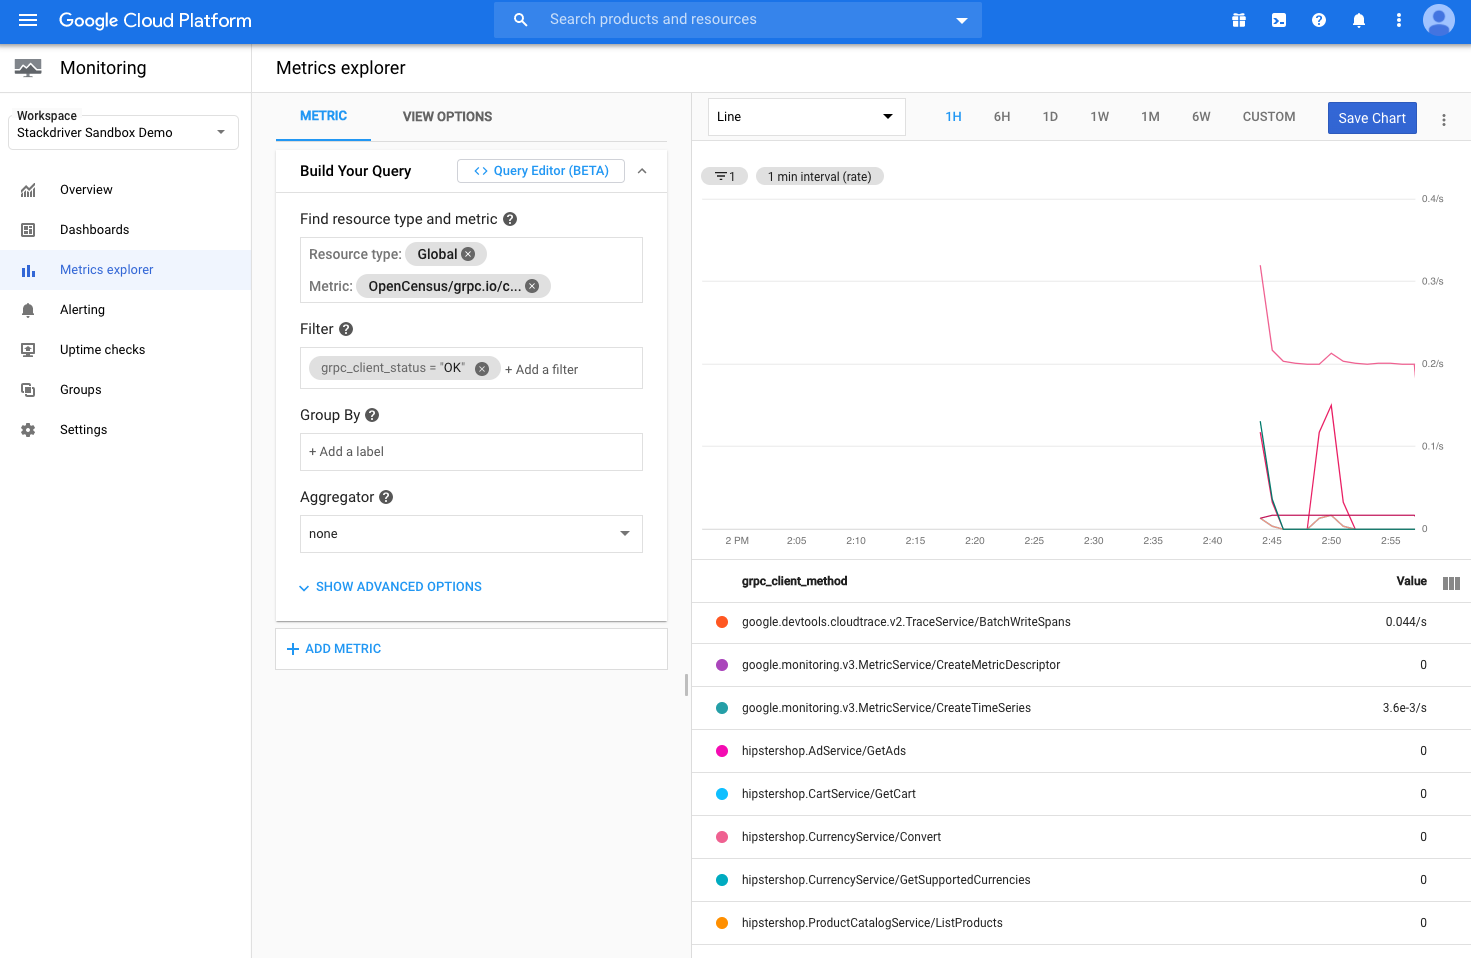
See more about metric filters in the documentation.
Monitoring and logs-based metrics
Cloud Logging allows to generate metrics from logs. They are referenced as log-based
metrics. Sandbox creates one log-based metric for Online Boutique.
In Metric Explorer search for checkoutservice_log_metric to see a counter metric
that keeps track about number of ordered products which can be further filtered by
the product name or product id (using labels).
You can see all log-based metrics if you open Log-based Metrics in Cloud Console.
See more about log-based metrics in the documentation.
SLO Monitoring
Service Level Objectives (SLOs) are a core tool in the Cloud Monitoring
service. You can navigate to it by selecting Services in the navigation panel of
Cloud Monitoring in Cloud Console.
This tool gives you a consice and low-noise signal about your service reliability
following best practices of SRE from Google.
Cloud Monitoring identifies potential service or candidates for SLO tracking by looking at services deployed on App Engine, GKE and Cloud Run. You can select then define a service to be used for SLO monitoring among them or to use a custom-defined service. Cloud Monitoring applies auto-discovery mechanism to automatically define microservices built using the following development frameworks:
- App Engine: App Engine has a strong notion of microservice, called an App Engine service (and formerly a module). Each service is distinguished by its own app.yaml configuration file.
- Anthos Service Mesh (ASM): Cloud Monitoring supports service meshes built atop a single GKE cluster. In this configuration, an Anthos Service Mesh service corresponds directly to a GKE service. All Anthos Service Mesh services, both user-managed and system-managed, are automatically detected.
For these services you can define service-level objectives (SLOs) using standard availability and latency metrics that the services provide implicitly. For other candidate services (e.g. Kubernetes services) and custom services you will have to define which metrics should be used and, possibly, implement the metric collection and ingestion.
Cloud Ops Sandbox configures availability and latency SLOs for all Online
Boutique services when launched with ASM. It uses the standard availability
configuration with a customized latency SLO that is defined using the Istio
generated metric istio.io/service/server/response_latencies as following:
90% of all valid responses are returned within 1000(ms) during last 30 days
The request latency for the service_name service is acquired from metrics using the following filter:
metric.type="istio.io/service/server/response_latencies"
AND resource.type="`k8s_container`"
AND resource.label."`cluster_name`"="`cloud-ops-sandbox`"
AND metric.label."`response_code`"="`200`"
AND metadata.user_labels."`app`"="<_service_name_>"
Note The name of the cluster can be different if you customized it at launch (using
--cluster-nameparameter).
SLO Alerts
You can create alerts to notify you when SLO is broken or when Error Budget burning rate is higher than expected.
Cloud Ops Sandbox defines SLO alerts based on the slow-burn threshold of 2x the baseline with a 2-minute lookback period. A common practice for the slow-burn alerts to use hour resolution for lookback periods. Sandbox uses minute resolution to demonstrate results faster.
The alerts are configured to send notification to non-existing email. If you want to see how the alert notification looks like, you can edit the email address in the alert notification channel by:
- Opening Notification Channels in Cloud Console
- Finding the list of Email channels
- Finding the channel with Email that reads
devops@acme.com - And editing the email on the channel
Cloud Logging
Operators can look at logs in Cloud Logging to find clues explaining any anomalies in the metrics charts.
Using Logging
You can access Cloud Logging by selecting Logging from the GCP navigation menu. This brings up the Logs Viewer interface:
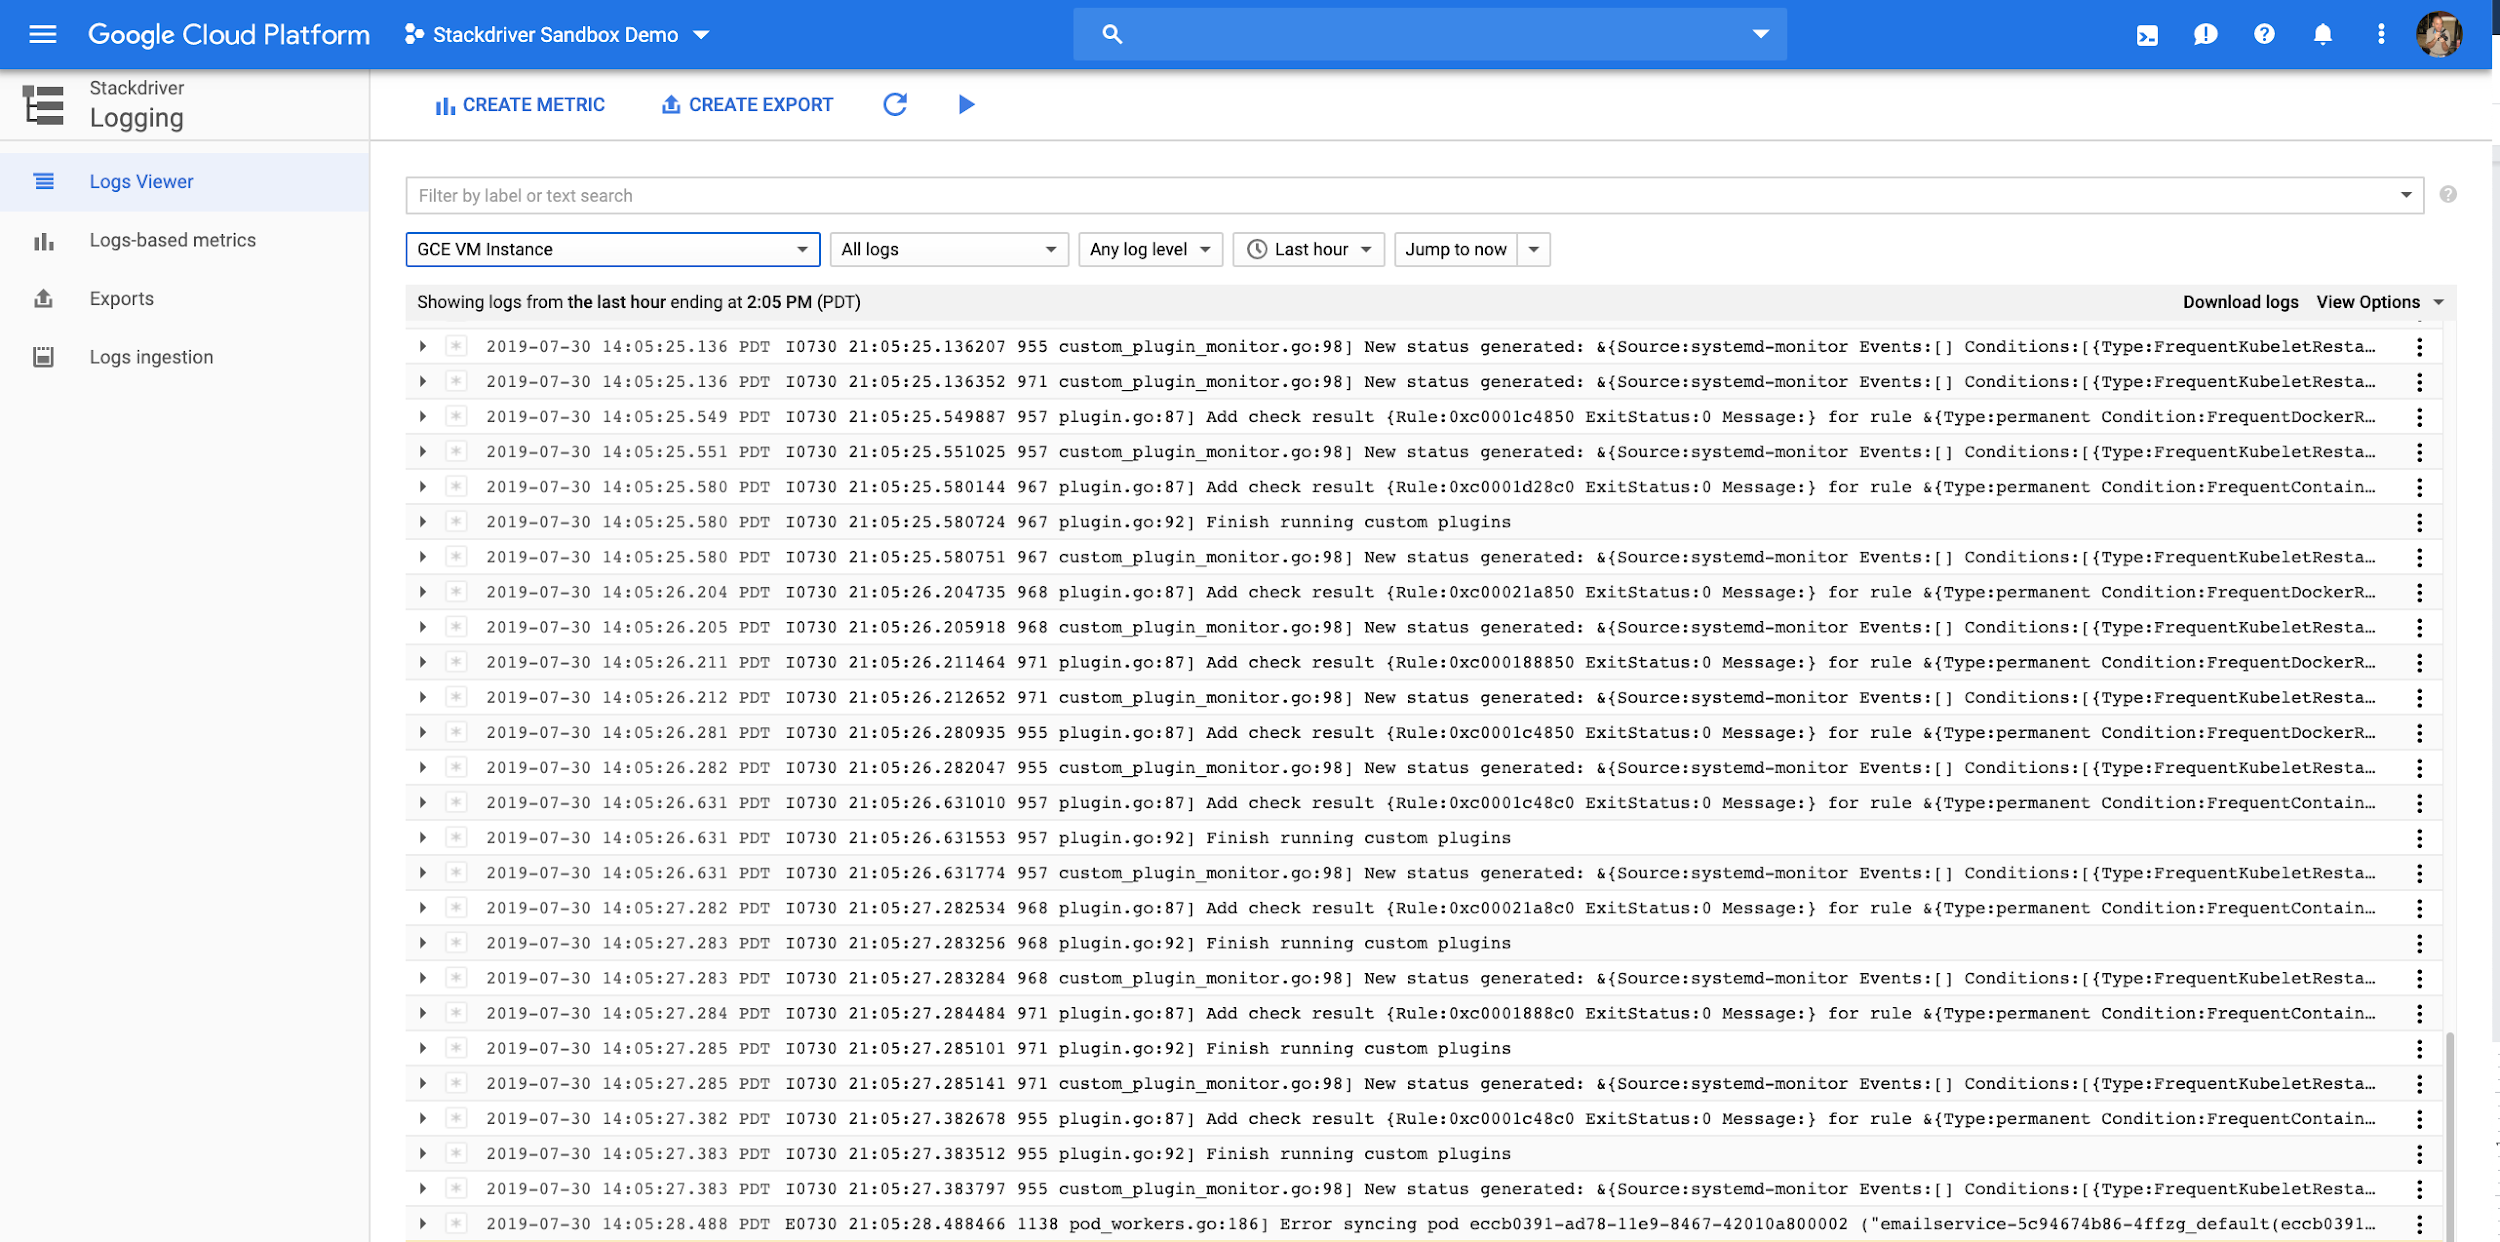
The Logs Viewer allows you to view logs emitted by resources in the project using search filters provided. The Logs Viewer lets you select standard filters from pulldown menus.
An example: Online Boutique service logs
All Online Boutique workload in GKE is deployed to the default namespace.
To view all logs emited by the Online Boutique services do the following:
- Open
Log Explorerin the navigation panel -
In the panel on the left from the logs set up filter parameters
- For RESOURCE TYPE select
Kubernetes Container - Skip other fields until you find CONTAINER NAME and select
cloud-ops-sandbox. Mind that the name of the cluster can be different if you customized it at launch (using--cluster-nameparameter). - Skip to NAMESPACE NAME and select
default. - Skip to CONTAINER NAME and select
server.
The same result can be achieved by copy/pasting the following filters in the Query area:
resource.type="k8s_container" resource.labels.cluster_name="cloud-ops-sandbox" resource.labels.namespace_name="default" resource.labels.container_name="server" - For RESOURCE TYPE select
- Press “Run Query” button
The Logs Explorer will display all logs generated by all Online Boutique services.